Summary
The overall aim of project B04 is the understanding of the underlying physical mechanisms on the micro-structure level which lead to formation of damage during forming processes. In the first two funding periods, the focus was on bulk forming of case hardening steel 16MnCrS5, and is now being extended to other materials to identify general similarities in damage formation during forming.
In the first FP the delamination as well as the fracture of the MnS inclusions could be identified for 16MnCrS5 as the main damage initiation processes by in-situ bending experiments. A reliable method for quantification of the damage state was developed based on automated particle detection routines in backscatter electron images combined with the collection of EDX spectra. In parallel to the studies on damage evolution, the hardening of the material was monitored by EBSD-based measurements of geometrically necessary dislocation (GND) densities.
In the second FP, the influence of the measurement parameters on the damage quantification was examined to quantify the measurement uncertainties in the characterization which will contribute to the general reliability analysis of in the TRR in the next funding period. On the microstructural level the higher-resolved analysis of individual dislocation behavior in the surrounding of damage sites by controlled Electron Channeling Contrast Imaging (cECCI) was intensified and yielded characteristic differences between regions of compressive and tensile strain within a bending sample. For comparison, selected samples were analyzed by TEM. Temperature influences during and after the forming were analyzed by in-situ heating experiments. All attempts to overcome the difficulties of measuring local strain by cross-correlating EBSD measurements have been unsuccessful and local strain measurements on heavily deformed specimens have therefore been discontinued.
In the third FP, B04 will adapt the developed damage quantification method to new materials, which are now the focus of the TRR. For the new lightweight materials, especially aluminum alloys, this will include fundamental analyses of suitable preparation techniques that do not close the voids during preparation. To analyze the material structure in terms of local hardening, interfaces and damage initiation, high-resolution characterization techniques (cECCI and TEM) will be continued. The next step from the 2D to the 3D characterization of the damage state will be taken by two techniques that have not been used so far. These are serial sectioning of comparatively large volumes followed by tomographic analysis by plasma FIB and, especially for Al-based materials, Micro-CT. This combination of techniques will allow a hierarchical selection of sample volumes with decreasing dimensions at increasing resolution, thus supporting the correlative approach to define the relevant damage processes at different length scales.
Project progress to date
Generation of defined strain states in the LC-SEM (WP 1) & cECCI/STEM (WP 2)
The high-resolution investigation of dislocation structures requires work pieces which exhibit a low mechanical strain. For this purpose, bent specimens from the in-situ experiments in the Large-Chamber SEM (LC-SEM) were used. The specimens were embedded so that the entire range from tensile to compressive strain is accessible for electron channeling contrast imaging (cECCI) measurements. Thus, the influence of tensile and compressive strain on the interaction between dislocation and damage can be investigated. Fig. 1 illustrates the area around a MnS inclusion under compressive strain. Due to the strain state, few to no damage can be found here. The cECCI images show that the dislocations are present in a directional manner. Furthermore, nano-inclusions can be observed, at which dislocations can accumulate.
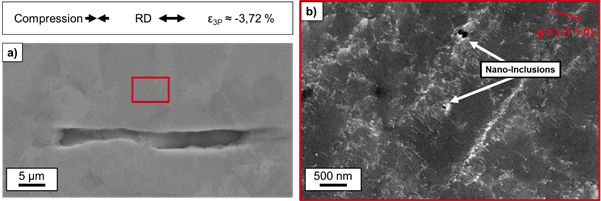
Fig. 1: a) SE image of MnS from bending specimen in compressive stress range. b) cECCI image of dislocation structure of the area marked in red in a).
The area of the bending specimen under tensile strain offers more interesting observation points, since damage occurs more frequently here. Such a MnS is exemplarily shown in Fig. 2. The corresponding EBSD map (Fig. 2(b)) shows that the large void occurs at a grain boundary (intercrystalline) and the smaller crack is present within the MnS grain (transcrystalline). Additionally, cECCI images show that the damage at the grain boundary is not related to the dislocations of the surrounding iron matrix. Above and below the void, there was no observable accumulation of dislocations. In the case of the transcrystalline crack a pronounced shear band is present near the crack. The investigation of the dislocation structure in tension and compression regime shows that dislocations are not directly related to damage, since the dislocations do not produce any damage and damage can also be caused by factors such as internal grain boundaries of the inclusions. However, a high number of dislocations such as shear bands can support or initiate the formation of voids in areas under tensile stress.
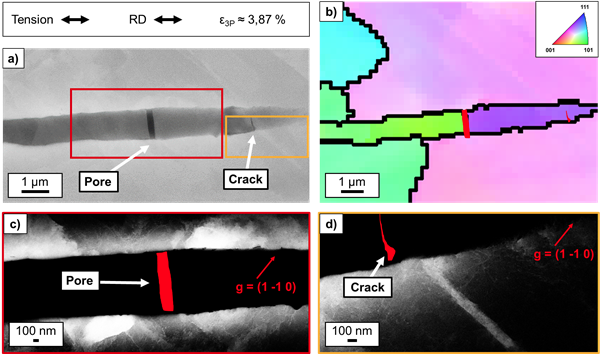
Fig. 2: a) SE image of damaged MnS from bending specimen in tensile stress region. b) IPF map showing the grain structure of the inclusion. c) cECCI image near the voids. Accumulation of dislocations was not observed at the void. d) cECCI image near the crack.The crack lies within a MnS grain and near a shear band.
Comparable findings can be corroborated from STEM investigations carried out on FIB lamellae, which were also taken from areas under tensile strain in bending specimens. Fig. 3 shows a STEM-ADF image of an area in the surrounding of a damaged MnS inclusion. The damage occurs in the form of a MnS grain boundary fracture as well as in the form of a cementite fracture. Dislocations accumulated in an angle of 45° to the tensile load and aligned with the damage location. The stress field generated by the dislocations causes the fracture at the point of intersection with the cementite, and also further away at the grain boundary.
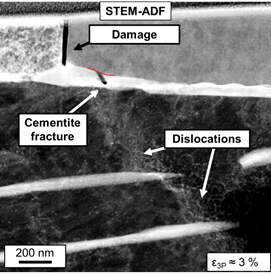
Fig. 3: STEM ADF image of a damage site from a bending specimen (ε3P ≈ 3 %). Dislocation accumulation present near damage. Damage is observable in the form of of MnS grain boundary fracture, as well as cementite fracture.
HR-EBSD (WP 3)
For improving the results from HR-EBSD strain measurements, unstrained reference patterns of the same orientation are necessary. Since the chance of obtaining such undisturbed patterns decreases with increasing overall strain of the sample, an attempt was made to create such a pattern in a relaxed column fabricated with FIB machining.
Fig. 4 shows the selected site before (a)) and after (b)) pillar fabrication. However, during FIB machining the pillar surface was subjected to excess ion irradiation which significantly decreased electron backscatter diffraction pattern quality as is shown by the Kikuchi pattern in Fig. 4. Attempts to clean the pillar surface by subsequent low-energy Ar ion polishing could not reproduce the initial pattern quality which would have been needed to improve the HR-EBSD measurements. Alternatively, the use of dynamically simulated reference patterns was tested, but led to systematic artificial strain gradients by slight differences in the projection geometry between simulated and experimental patterns. Since these problems could not be solved, the attempts to perform strain measurements by HR-EBSD in these highly deformed materials will not be continued in the 3rd FP.
Fig. 4: (a) BSE image of an EBSD measurement field in bending specimen before fabrication of the FIB-pillar with corresponding Kikuchi pattern. b) BSE image and Kikuchi pattern of the FIB pillar.
Further Analysis of the damage quantification method (WP4)
In the first funding period, damage quantification using EDX particle analysis was established as a reliable method. The new field emission SEM "GeminiSEM 300", installed in 2019, offers enhanced possibilities to carry out measurements at lower electron energies. The influence of lower energies on the damage quantification was investigated experimentally.
As can be seen in Fig. 5 a) the observable void size on damaged MnS inclusions varies with the acceleration voltage used. As expected, images taken at 5 kV show a higher image resolution and therefore a sharper void image and stronger void contrast. Whereas, the larger probe volume at high acceleration voltages prevents shallower voids from being detected. Fig. 5b) shows the influence on overall damage measurements. As expected the number of detected damage sites varies especially for damage sites with small void areas, here below 0.1 µm2. These differences can add up to an uncertainty in the total area fraction of the voids in the range by a factor of 2. Therefore, to maintain comparability of results over a given test series a constant choice of acceleration voltage is indispensable.
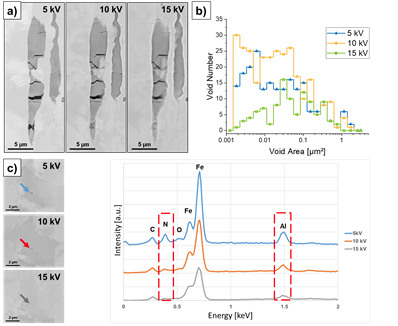
Fig. 5: (a) Backscatter electron (BSE) images of an individual damage site in a 16MnCrS5 specimen subjected to tensile test (ε = 10%) at different acceleration voltages (b) Influence of the acceleration voltage on overall damage measurements of a tensile specimen (f = 0.1) (c) AlN precipitate in the nanometer size range at different acceleration voltages and the corresponding EDX spectra.
Not only the image acquisition is affected by the variation of electron energies, but also the complementary recorded EDX spectra. This is examplified on a nanoparticle shown in Fig. 5 c) clearly demonstrating that the detection of smaller precipitates can is facilitated by lower accelerating voltages. The spectra also show that signals from lighter elements such as aluminum and nitrogen are more clearly defined at 5 kV. Ultimately, the quantification of smaller, lighter precipitates such as AlN and BN is only reliable at low voltages.
Temperature Influence (WP 5)
With the help of the in-situ bending module, which was already used in the first FP to investigate the damage mechanisms during mechanical loading of the 16MnCrS5 steel, the influence of the temperature during bending could be investigated. For this purpose, 16MnCrS5 bending specimens were heated in the LC-SEM to temperatures of 150 and 200 °C and bent at constant temperature. In-situ SE images at a three-point bending strain (ε3P) of approx. 8 % are shown in Fig. 6. Despite the decrease in image quality with temperature, it can be seen that less damage occurs at 200 °C. The damage occurs in the case-hardened steel due to fracturing and the delamination of the MnS inclusions. An increase in the ductility of the inclusions with increasing temperature thus has a damage-inhibiting effect.
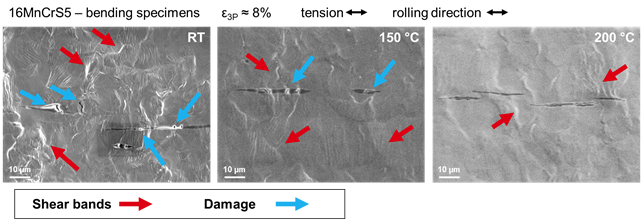
Fig. 6: SE images from in-situ bending test in the large-chamber SEM, carried out at different temperatures. The blue arrows indicate exemplary damage sites, the frequency of which decrease with increasing temperature.
In order to analyze the influence of high temperatures on existing damage, extruded specimens were annealed with an in-situ heating module from Kammrath & Weiß at stress relief and normalizing temperatures. Fig. 7 shows the change in microstructure after 5 hours of annealing.
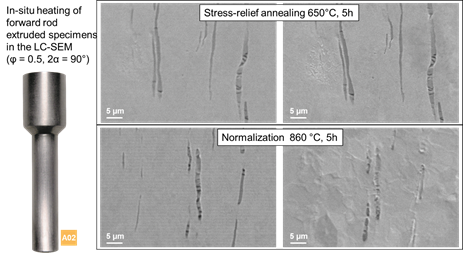
Fig. 7: In-situ heating test on extruded (ϕ=0.5; 2α=90°) samples. BSE images before and after annealing times of 5 hours at 650°C and 860°C.
While for the stress relief annealing, the damage remains largely unaffected in the normalizing annealing process, a movement of the matrix material can be observed. The steel of the matrix diffuses so that it lies above the MnS inclusions in the polished section. While the inclusions thus remain broken, the permeation of surrounding material into the void volumes can be observed sporadically.
Preliminary work
PlasmaFIB:
The use of a Plasma FIB to analyze the damage mechanisms and microstructure alterations in rolling contact fatigue of SAE52100 bearings leading to white etching crack formation could be demonstrated by the applicants in collaboration with the Institute for Materials Applications in Mechanical Engineering at RWTH and Thermo Fisher Scientific, Hillsboro, USA ([Oez18]). A cube of approx (100µm)3 was sliced, imaged with backscattered electrons to visualize the microstructure, and afterwards reconstructed and segmented to visualize the spatial arrangement of cracks and microstructure alterations (Fig. 8).
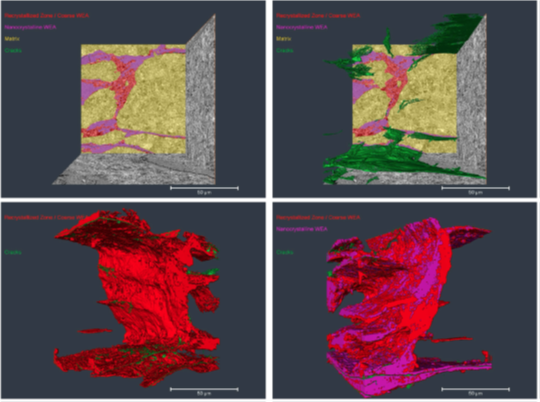
Fig. 8: Spatial distribution of cracks and microstructure alterations in SAE 52100 after test in a four-wheel test rig at IWM, RWTH Aachen (from [Oez18]).
Micro-CT:
In the context of TRR 188, a first feasibility study on the use of micro-CT for damage analysis in aluminum alloys was carried out. Fig. 9 shows the distribution of voids and precipitates close to the fracture surface of a tensile test specimen of aluminium alloy AW-6082. The homogeneity of the void distribution within the analyzed volume will be assessed and the volume fraction of the observed voids will be quantified in a similar manner to this analysis.
In contrast to 3D analysis with PFIB, this method is non-destructive, i.e. the analyzed material is still available after the analysis and can be used for higher resolution techniques such as SEM or TEM, or by other projects such as B03 for nano-CT. A particular advantage of this approach is that it allows a hierarchical selection of sample volumes with decreasing dimensions and increasing resolution.
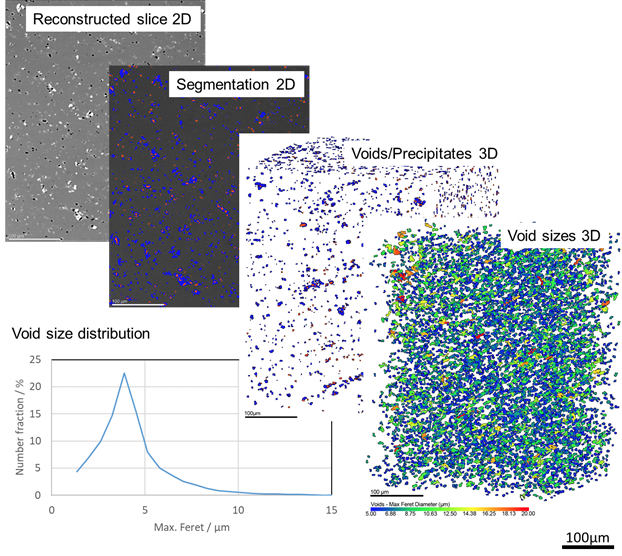
Fig. 9: 3D reconstruction of the voids and precipitates close to fracture of a tensile test specimen of aluminium alloy AW-6082 using Micro-CT and derived void size distribution.
Regarding the objectives of TRR188, the Weirich group has long experience in the characterization of various structural materials, including steels and aluminum. As an example, we show here the results within a combined Micro-CT, SEM and (S)TEM investigation on aluminum alloy AW-6082 sheet specimens after tensile testing. Fig. 10 shows the two regions of the tensile test specimen that were investigated. The undeformed area was analyzed for comparison with the highly deformed area close to the fracture surface. The microvoid analysis by Micro-CT (see Fig. 9) was followed by SEM-EBSD characterization of both regions, resulting in the KAM maps shown in Fig. 10. While the EBSD KAM map of the undistorted pristine region is modest, the corresponding KAM map of the severely deformed region clearly shows dislocation accumulation along slip bands, grain boundaries and precipitates. To obtain structural information beyond the inherent resolution limits of SEM-EBSD, a FIB cross section was taken from the heavily deformed region with a nearby large void containing a precipitate to be examined by (S)TEM. According to the recorded selected area electron diffraction patterns, the base material is confirmed as fcc aluminum (a= 4.085(9) Å) and the structure of the nearby large precipitate is bcc Mn1.5Fe2.12Cr0.18Al16Si2. As shown by the contrast in the bright field TEM image, the matrix contains many dislocations accumulated in the region close to the phase boundary (top right image in Fig. 11). Subsequent ACOM TEM analysis over a larger area shows that the base material is highly misoriented, as shown by the colour changes in the inverse pole figure map. To complement the EBSD results, the ACOM TEM results were used to calculate a higher resolution KAM map (Fig. 10). Thus the geometrically defined top-down approach presented here will enable our project partners to link process parameters and direction with the key figures of crystallographic change in the structure down to the nanometer scale.
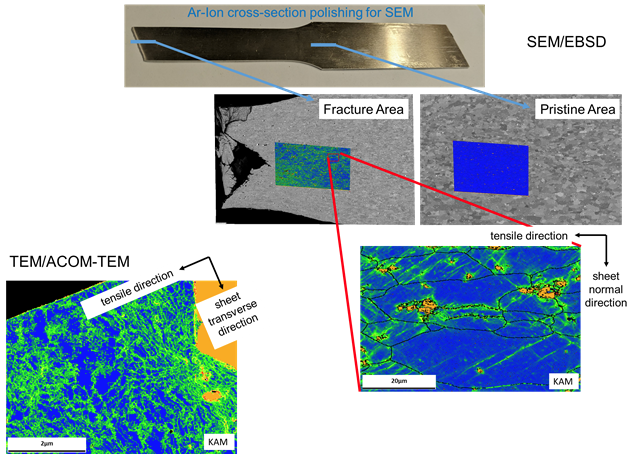
Fig. 10: Correlative EBSD and ACOM-TEM analyses on two regions of a tensile test specimen of aluminum alloy AW-6082. The undeformed area was analyzed as a comparison to the highly deformed area near the fracture. The micro-void analysis by Micro-CT (see Fig. 9) was followed by SEM-EBSD characterization of both regions which yielded the here shown KAM maps for both regions. Whereas the EBSD KAM map from the undistorted pristine area is modest, the corresponding KAM map from the heavily deformed area shows dislocation accumulation along slip bands, grain boundaries and precipitates. As illustrated by the map shown in the lower left-hand corner of the figure, KAM maps with lattice misorientation information on an even smaller length scale can be obtained by ACOM TEM on a FIB cross section.
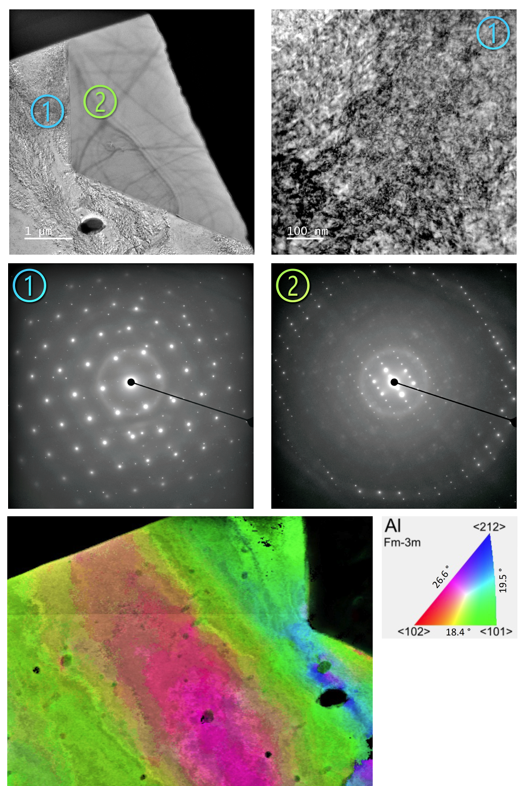
Fig. 11: TEM investigation of a FIB cross section of a tensile test specimen of aluminum AW 6082. The FIB section was taken from the heavily deformed region with a nearby large void containing a precipitate. While region (1) of the base material shows the diffraction pattern of fcc aluminium (a = 4.085(9) Å) in the <110> direction, the precipitate at position (2) could be identified as cubic Mn1.5Fe2.12Cr0.18Al16Si2. In addition, the analyzed region (1) of the base material contains a large number of dislocations as shown by the contrast in the TEM bright field image (upper right image). A subsequent ACOM-TEM analysis (bottom row) reveals that the investigated sample is highly strained as indicated by the colours in the inverse pole figure map. The results from the latter analysis were used to calculate the KAM map shown in Fig. 10.
Project-related publications within TRR 188:
[Her20] O. Hering, A. Dunlap, A. E. Tekkaya, A. Aretz, and A. Schwedt, "Characterization of damage in forward rod extruded parts,", International Journal of Material Forming 13(6), 1003-1014, 2020, DOI: 10.1007/s12289-019-01525-z
[Imr20] M. Imran, M. J. Afzal, J. Buhl, M. Bambach, A. Dunlap, A. Schwedt, A. Aretz, S. Wang, J. Lohmar, and G. Hirt, “Evaluation of process-induced damage based on dynamic recrystallization during hot caliber rolling,” Production Engineering 14 (1), 5-16, 2020, DOI: 10.1007/s11740-019-00932-0
[Kus20] C. F. Kusche, A. Dunlap, F. Pütz, C. Tian, C. Kirchlechner, A. Aretz, A. Schwedt, T. Al-Samman, S. Münstermann, and S. Korte-Kerzel, “Efficient characterization tools for deformation-induced damage at different scales,” Production Engineering 14 (1), 95-104, 2020, DOI: 10.1007/s11740-019-00936-w
[Wan20] S. Wang, A. Dunlap, K. Möhring, J. Lohmar, A. Schwedt, A. Aretz, F. Walther, and G. Hirt, “Torsion plastometer trials to investigate the effect of non-proportional loading paths in caliber rolling on damage and performance of metal parts,” Production Engineering 14 (1), 17-32, 2020, DOI: 10.1007/s11740-019-00949-5
[Rak23] T. Rakshit, A. Dunlap, S. Kraemer, A. Schulze, A. Aretz, A. Schwedt, A. E. Tekkaya, “Damage Evolution in Axial Forming of External Splines and Quenching Operation of the Tubular Gear Shafts”, ICTP 2023: Proceedings of the 14th International Conference on the Rechnology of Plasticity – Current Trends in the Technology of Plasticity, 215-222, 2023, DOI: 10.1007/978-3-031-42093-1_21
Preliminary work of the applicants outside of TRR 188 with relation to the 3rd FP:
[Bör21] J. M. Börgers, J. Kler, K. Ran, E. Larenz, T. E. Weirich, R. Dittmann, R. A. De Souza, “Faster Diffusion of Oxygen Along Dislocations in (La,Sr)MnO3+δ Is a Space-Charge Phenomenon”,. Adv. Funct. Mater. 31, 2021, 2105647. DOI: 10.1002/adfm.202105647
[Ehl21] L.C. Ehle, J. Spille, H. Meyer, J. Kämmler, J. Werner, A. Schwedt, J. Epp, T.E. Weirich, J. Mayer, “Controlled twinning and martensitic transformation in metastable AISI D3 (X210Cr12) steel by sequential deep rolling and liquid nitrogen cooling”, Materials Today Communications, 28, 2021,102484, DOI: 10.1016/j.mtcomm.2021.102484.
[Kop23] A. Kopp, J. Werner, N. Kröger, T. E. Weirich, F. D'Elia, "Combined severe plastic deformation processing of commercial purity titanium enables superior fatigue resistance for next generation implants", Biomaterials Advances, 2023, DOI 10.1016/j.bioadv.2023.213756
[Oez18] M. Oezel, A. Schwedt, T. Janitzky, R. Kelley, C. Bouchet-Marquis, L. Pullan, C. Broeckmann, J. Mayer, “Formation of white etching areas in SAE 52100 bearing steel under rolling contact fatigue – Influence of diffusible hydrogen”, Wear 414-415, 352-365, 2018, DOI: 10.1016/j.wear.2018.08.022
[Sei23] E. Seif, J. Rösler, J. Werner, T.E. Weirich, J. Mayer, “Investigation of TaC and TiC for Particle Strengthening of Co-Re-Based Alloys”, Materials, 16, 2023, 7297; DOI: 10.3390/ma16237297
[Wei24] T.E. Weirich, "Atlas of zone axis spot patterns for cubic lattices", 2024, DOI: 10.18154/RWTH-2024-02030